Roadmap / Gantt

Enjoy your
planning
The most flexible and the most comprehensible visual for reporting plans, schedules and roadmaps.
Clearly presents your project/portfolio, product(s) or campaign plans, or plans of whatever else that can be time-scheduled. Present your phases as well as key milestones. All in a one-page or scrollable view.
Get Trial


Discover the most flexible and visually engaging way to plan and track your projects, roadmaps, and schedules.
Groups and hierarchy
Utilize a multi-level structure for clear visualization – including groups, subgroups, and hierarchy, with an additional column for extra information.
Descriptions
Enrich phases by titles and comments for bars. For longer text, you can choose how it behaves when overflowing: hide it, truncate it with '...', wrap it into multiple lines, or do nothing and let it overflow.
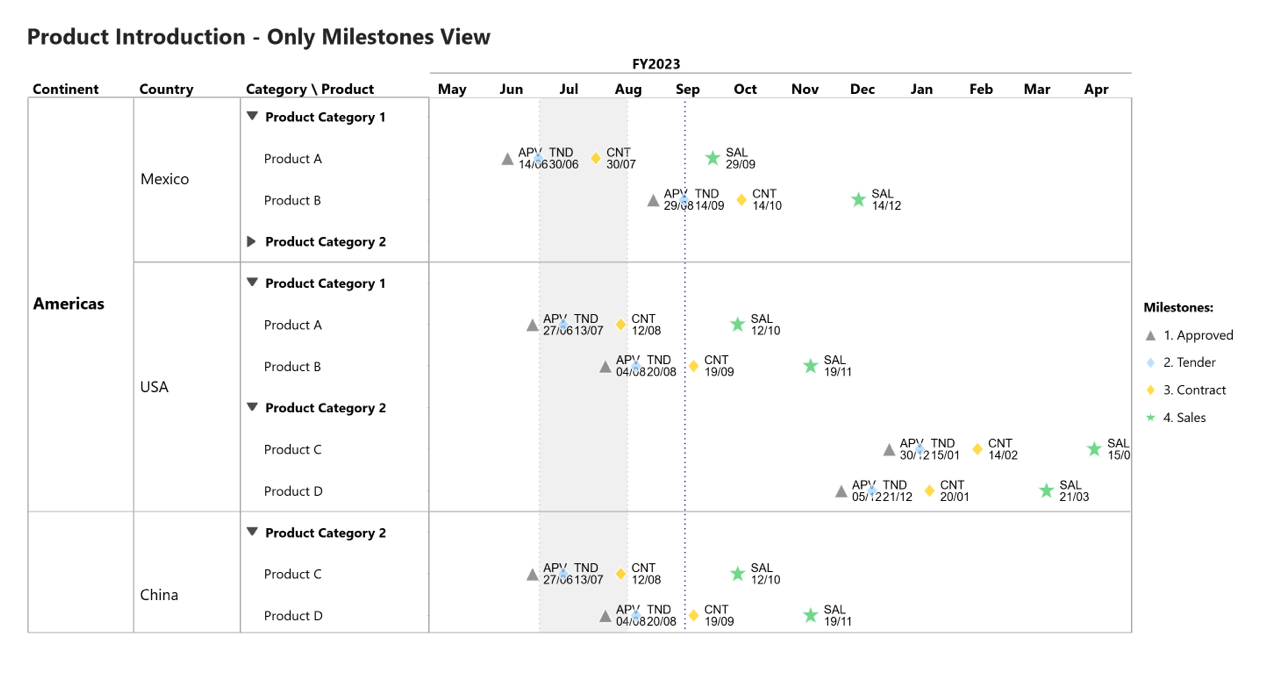
Views
Display phases and milestones together, only phases, or only milestones. Phases can also be shown side by side. Optionally hide the left axis and focus solely on the timeline.
Zoom / Scale
Customize zoom settings with precise controls. Adjust horizontal and vertical zoom, set row height, and define the initial, minimum, and maximum zoom periods. Enable automatic 'Today' focus.
Robust timeline
Take full control of your timeline with adjustable settings for hours, days, weeks, months, quarters, and years. Configure primary and secondary axes, gridlines, intervals, and more.
Actual vs Plan
Compare planned vs. actual progress with precision. Visualize deviations and stay on track with your goals.
Progress bar
Visualize task completion directly on the timeline. The progress is displayed as a saturation fill within the bar, providing a clear overview of ongoing and completed work.
Target lines
Set multiple target lines and intervals as needed. They will be displayed from top to bottom of the visual and can include customizable titles and labels.
Bar shapes
Customize your roadmap with different bar shapes, including arrows, rectangles, and more, for a visually engaging experience.
Conditional formats
Apply dynamic formatting to highlight key phases, milestones, priorities, or statuses. Use colors and shape styles to improve readability.
Legend
Customize the legend to improve clarity and readability. Choose to display it for bars, milestones, or both, set its placement (left, right, top, or bottom), and adjust alignment.
Sorting
Sort your data efficiently by different criteria. Choose to sort by Group, SubGroup, and AxisY (hierarchical levels) or by Start Date (time) to ensure a structured and logical order in your roadmap.
15
Milestones shapes
CHART EXAMPLES
Create clear and structured roadmaps with multi-level grouping and hierarchy, ensuring better organization of your projects. Display phases, milestones, and progress bars to keep track of key developments and deadlines.
Customize your timeline with flexible formatting options, including various bar shapes, conditional styling, and zoom controls for an optimized view of your schedule.
Live demo